
IIP September 2026: industrial growth slows to 6.7% as mining shrinks
 By Neha KapoorEconomy Correspondent, Peepals Business
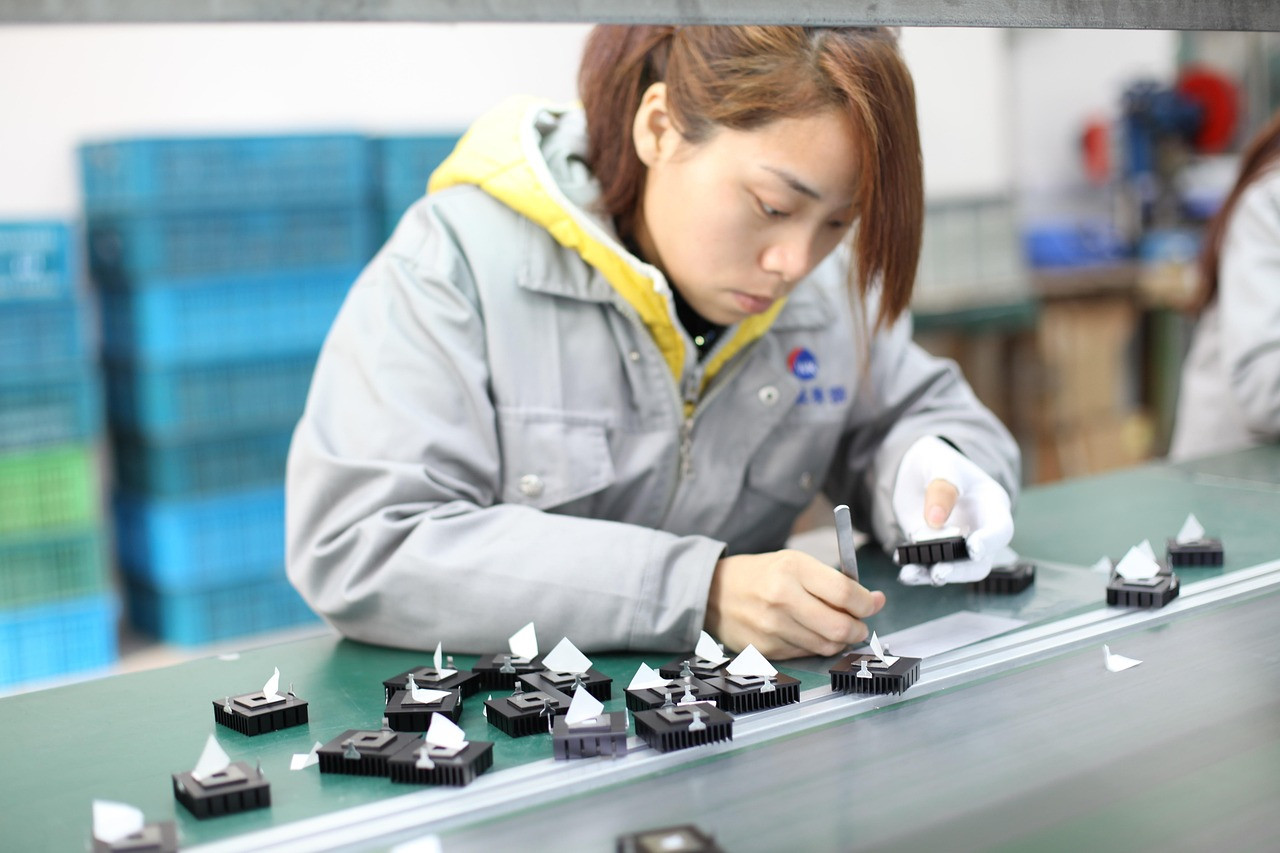
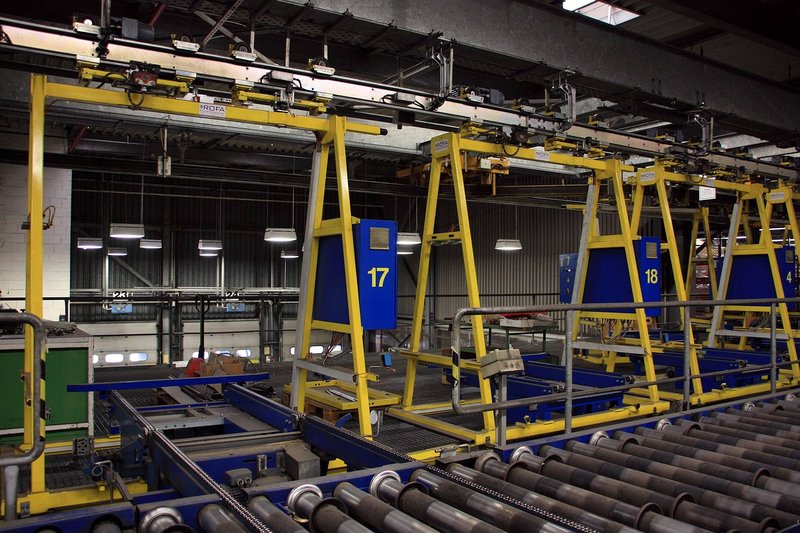
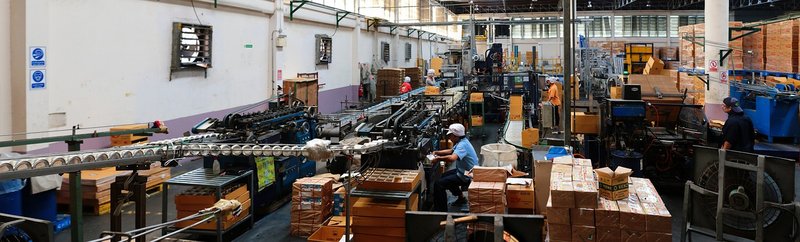
Representative image: qq37909485 / Pixabay
India's industrial output grew 6.7% in September 2026, MoSPI said on October 28, as 7.6% manufacturing growth was offset by a 6.2% fall in mining.
What Happened
India's industrial output grew 6.7% in September 2026 from a year earlier, slower than in August, according to the quick estimate of the Index of Industrial Production (IIP) released by the Ministry of Statistics and Programme Implementation (MoSPI) on Wednesday, October 28, 2026. Manufacturing grew 7.6% and electricity and gas supply 11.2%, but mining and quarrying shrank 6.2%, pulling the overall rate down. August's growth had been first estimated at 8.0%.
Key Facts
- Release: quick estimate for September 2026, published by MoSPI's National Statistics Office on October 28, 2026.
- Headline growth: 6.7% year on year; the index stood at 124.3, against 116.5 in September 2025.
- Manufacturing: up 7.6%.
- Electricity and gas supply: up 11.2%.
- Mining and quarrying: down 6.2%, after a fall of 4.6% in August.
- By use of goods: intermediate goods up 12.2%, capital goods up 10.4%, infrastructure and construction goods up 7.2%, consumer durables up 6%, primary goods up 4% and consumer non-durables up 1.4%.
- Base year: the series now uses 2022-23 as its base year, replacing 2011-12, from June 2026.
- Expectations: economists polled ahead of the release had expected about 7.3%, according to reports.
Why It Matters
The IIP measures how much India's factories, mines and power plants produce each month, compared with the same month a year earlier. It is one of the earliest signals of how the economy is doing, well before quarterly GDP figures. A 6.7% rise is solid growth, but the slowdown from August and the miss against forecasts show that the pace is not even across sectors.
The weak spot is mining. Mining and quarrying output fell for a second month, down 6.2% after a 4.6% drop in August. The release does not give a reason, and the next few months' data will show whether this is a short dip or a longer slide.
The stronger parts point to investment. Capital goods, the machines and equipment companies buy to expand capacity, rose 10.4%. Infrastructure and construction goods, such as steel and cement used in building, rose 7.2%. Intermediate goods, the inputs that go into other products, rose 12.2%. Together these suggest that companies and the government are still spending on building and expanding.
The weakest consumer reading is consumer non-durables, everyday items such as food products, soaps and medicines, which grew only 1.4%. Consumer durables, such as cars, appliances and electronics, grew 6%. On these numbers, output of everyday goods is growing far more slowly than output of bigger-ticket items.
These figures are a quick estimate based on early data from factories, and MoSPI revises them in later months as more returns come in. Readers comparing with older numbers should also note the new 2022-23 base year, which changed the weights and items in the index.
| Sector or use group | Growth in September 2026, year on year |
|---|---|
| Overall IIP | 6.7% |
| Manufacturing | 7.6% |
| Electricity and gas supply | 11.2% |
| Mining and quarrying | -6.2% |
| Capital goods | 10.4% |
| Consumer non-durables | 1.4% |
Impact
Short-term: The slower print and the mining decline will be weighed by economists and the Reserve Bank of India alongside inflation and other data when judging the pace of growth. For businesses that supply mining, the figures signal weaker demand for now.
Long-term: Steady growth in capital and infrastructure goods supports the view that investment is driving industrial activity. If consumer non-durables stay weak, makers of everyday goods may find it harder to grow volumes, which would show up in their sales.
Who is affected: Manufacturers and their workers, mining companies and the states that depend on mining, power producers, makers of everyday consumer goods, investors who track economic data, and policymakers.
What it means for your money or business: The figures suggest demand is stronger for capital and construction goods than for everyday consumer goods. A business planning stock or hiring can use the IIP's sector breakdown as one signal among several, keeping in mind that quick estimates are revised.
Key Takeaway
India's industrial output grew 6.7% in September 2026, as strong manufacturing and power were offset by a 6.2% fall in mining.
Questions and Answers
What was India's IIP growth in September 2026?
The quick estimate released by MoSPI on October 28, 2026, put industrial output growth at 6.7% year on year for September 2026, down from a first estimate of 8.0% for August.
Which sector pulled industrial growth down in September?
Mining and quarrying, which shrank 6.2% from a year earlier after a 4.6% fall in August, while manufacturing grew 7.6% and electricity and gas supply 11.2%.
What does the IIP measure?
The Index of Industrial Production tracks the volume of output from India's mining, manufacturing and electricity sectors each month, compared with the same month a year earlier. It now uses 2022-23 as its base year.
Are the September IIP figures final?
No. They are a quick estimate, and MoSPI revises them in later releases as more data from factories and other units comes in.
Disclaimer: Prepared by the Peepals newsroom from publicly available sources with AI assistance. Information is accurate to the best of our knowledge at the time of publication and may change. Images may be representative. Not professional advice. Report an error via our contact page.
By Neha Kapoor, Economy CorrespondentCovers Economy and more for Peepals Business. All stories by Neha Kapoor
Get the day's stories in your inbox
Peepals Weekly: the week decoded, free. One email a week, unsubscribe in one click.
Neha Kapoor is a pen name of the Peepals Global Editorial Team, which researches, fact-checks and publishes every story. The portrait is an illustration.