
US GDP grows 3.4% in Q3 as September PCE inflation rises to 3.6%
 By Neha KapoorEconomy Correspondent, Peepals Business

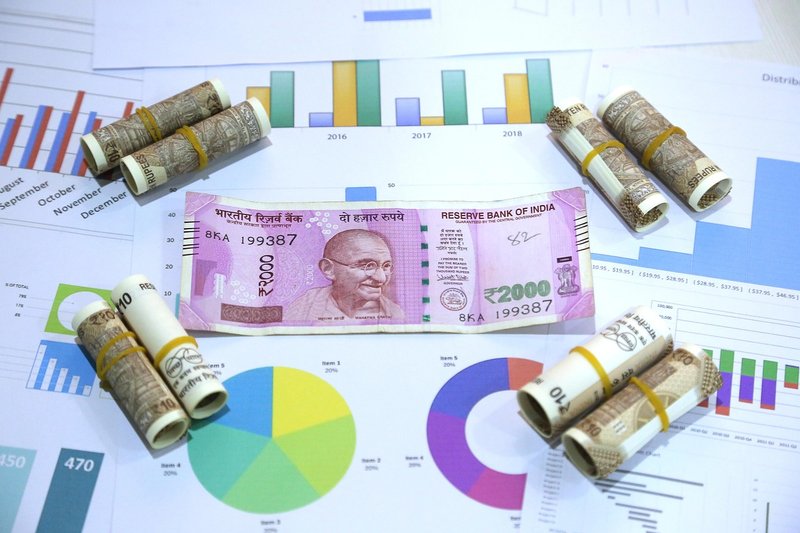
Representative image: Foto-Rabe / Pixabay
US GDP grew at a 3.4% annual rate in Q3 2026, BEA said on October 29, while September PCE inflation rose to 3.6% year on year.
What Happened
The US economy grew at an annual rate of 3.4% in the July-September quarter of 2026, faster than the 3.2% economists had expected, according to the advance estimate released by the Bureau of Economic Analysis (BEA) on Thursday, October 29, 2026. The same day, monthly data showed the personal consumption expenditures (PCE) price index, the inflation gauge the Federal Reserve watches most closely, rose 3.6% in September from a year earlier, up from 3.4% in August. The figures came a day after the Fed kept its policy rate unchanged.
Key Facts
- US real GDP grew at a 3.4% annualised rate in Q3 2026, up from 2.2% in Q2, the BEA's advance estimate shows; forecasts were about 3.2%.
- The BEA said growth was driven mainly by investment, consumer spending and government spending, partly offset by weaker exports.
- For the quarter as a whole, the PCE price index rose at a 2.1% annualised rate, down from 5.0% in Q2; core PCE, which excludes food and energy, rose 2.5%, down from 3.3%.
- For September alone, PCE inflation was 3.6% year on year and core PCE 3.1%, both in line with forecasts; month on month they rose about 0.5% and 0.3%.
- In September, personal income rose 0.2% while spending rose 0.5%; real disposable income fell 0.3% and the saving rate was 3.8%.
- The BEA's second estimate of Q3 GDP is due on November 25, 2026.
Why It Matters
Gross domestic product (GDP) measures the value of everything an economy produces. The US quoted figure is "annualised", meaning the quarter's growth is scaled up to show what a full year at that pace would look like. A 3.4% rate is strong for a large, mature economy and suggests American businesses and households kept spending through the summer.
The inflation picture is more mixed, and the two sets of numbers can look contradictory. The quarterly PCE figure compares average prices in July-September with the previous quarter, and it slowed sharply. The monthly figure compares September with September 2025, and it rose. Both are correct: price pressure eased over the quarter as a whole after a very hot second quarter, but the year-on-year rate was still climbing at the end of it, and at 3.6% it remains far above the Fed's 2% target.
The household data adds a warning sign. Spending grew more than twice as fast as income in September, and after adjusting for prices, disposable income fell. That means people were spending more partly by saving less, which cannot last for ever. If incomes do not catch up, consumer demand, the largest part of the US economy, could slow in the months ahead.
For the Federal Reserve, the combination of solid growth and sticky inflation makes a rate cut unlikely in the near term and keeps the possibility of a rise on the table. The Fed held rates on October 28, with reports noting that two members wanted an increase. For India, higher-for-longer US rates tend to strengthen the dollar and can pull foreign investment away from emerging markets, adding pressure on the rupee. Strong US demand, on the other hand, supports Indian exports of services and goods.
| Indicator | Latest | Previous |
|---|---|---|
| Real GDP growth, annualised (Q3 vs Q2) | 3.4% | 2.2% |
| PCE prices, quarterly annualised | 2.1% | 5.0% |
| Core PCE, quarterly annualised | 2.5% | 3.3% |
| PCE inflation, year on year (September vs August) | 3.6% | 3.4% |
| Core PCE, year on year (September vs August) | 3.1% | 3.0% |
Impact
Short-term: Markets will read the data as reducing the chance of US rate cuts. That can lift US bond yields and the dollar, which in turn affects currency and equity markets in India and other emerging economies.
Long-term: If spending keeps outpacing income, US growth could slow in 2027 even as inflation stays high, a difficult mix for policymakers. The November 25 revision will show whether the 3.4% figure holds.
Who is affected: US households facing higher prices; the Federal Reserve; global investors; and Indian exporters, importers and investors, for whom US rates and demand shape the rupee and order books.
Key Takeaway
The US grew at a faster-than-expected 3.4% annualised rate in Q3 2026, but September PCE inflation of 3.6% and falling real disposable income leave the Fed with little room to cut rates.
Questions and Answers
What was US GDP growth in the third quarter of 2026?
The BEA's advance estimate, released on October 29, 2026, puts real GDP growth at a 3.4% annualised rate, up from 2.2% in the second quarter and above forecasts of about 3.2%.
What was the PCE inflation rate for September 2026?
The PCE price index rose 3.6% from a year earlier, and core PCE, which excludes food and energy, rose 3.1%, both in line with forecasts.
Why did quarterly PCE inflation fall while the monthly figure rose?
They measure different things. The quarterly rate compares the average of July-September with April-June and slowed to 2.1%; the September figure compares prices with a year earlier and rose to 3.6%.
When will the GDP figure be revised?
The BEA's second estimate for the third quarter is scheduled for November 25, 2026.
Disclaimer: Prepared by the Peepals newsroom from publicly available sources with AI assistance. Information is accurate to the best of our knowledge at the time of publication and may change. Images may be representative. Not professional advice. Report an error via our contact page.
By Neha Kapoor, Economy CorrespondentCovers Economy and more for Peepals Business. All stories by Neha Kapoor
Get the day's stories in your inbox
Peepals Weekly: the week decoded, free. One email a week, unsubscribe in one click.
Neha Kapoor is a pen name of the Peepals Global Editorial Team, which researches, fact-checks and publishes every story. The portrait is an illustration.